ComfyUI Audio Waveform Visualizer
"A high-performance audio visualization suite for ComfyUI, enabling real-time canvas feedback and professional waveform image generation for audio-reactive workflows."
Empowers artists to create precise audio-reactive AI art by providing visual evidence of audio peaks and structures directly within the node graph.
Problem & Context
Standard ComfyUI workflows lacked native, high-performance audio visualization tools, making it difficult for users to inspect audio waveforms or generate visual representations of audio for complex video synthesis and audio-reactive projects.
Engineering Constraints
- ▸Must handle extremely long audio files efficiently without UI freezes
- ▸Provide both low-latency real-time feedback and high-fidelity static image outputs
- ▸Support multiple rendering engines (Matplotlib, FFmpeg) to suit different quality needs
Technical Architecture & Approach
Implemented a multi-tiered visualization strategy: a lightweight, downsampled JavaScript visualizer for immediate canvas feedback, complemented by backend-driven nodes for generating high-resolution RGBA image tensors suitable for video overlays.
Key Decisions & Trade-offs
JavaScript Canvas Visualizer
Implementing the primary visualizer in JS allows for smooth, real-time interaction on the ComfyUI canvas, avoiding the overhead of frequent server round-trips for UI updates.
FFmpeg for High-Performance Rendering
Leveraging FFmpeg filters for waveform generation ensures industrial-grade performance and scalability, particularly for hour-long recordings or multi-channel audio.
Intelligent Downsampling
To maintain responsiveness with large audio datasets, a peak-based downsampling algorithm was implemented to reduce data points while strictly preserving the visual envelope of the audio.
Engineering Retrospective
- ✓Client-side rendering for immediate feedback significantly improves the perceived performance of the node UI.
- ✓Abstracting complex FFmpeg commands into simple ComfyUI nodes makes professional audio tools accessible to a wider audience.
Documentation & Guides
Detailed integration guides, node parameter breakdowns, and setup manuals for this project.
ComfyUI Audio Waveform VisualizerAudio waveform visualization nodes for ComfyUI.
ComfyUI Audio Waveform Visualizer
Audio waveform visualization nodes for ComfyUI.
---
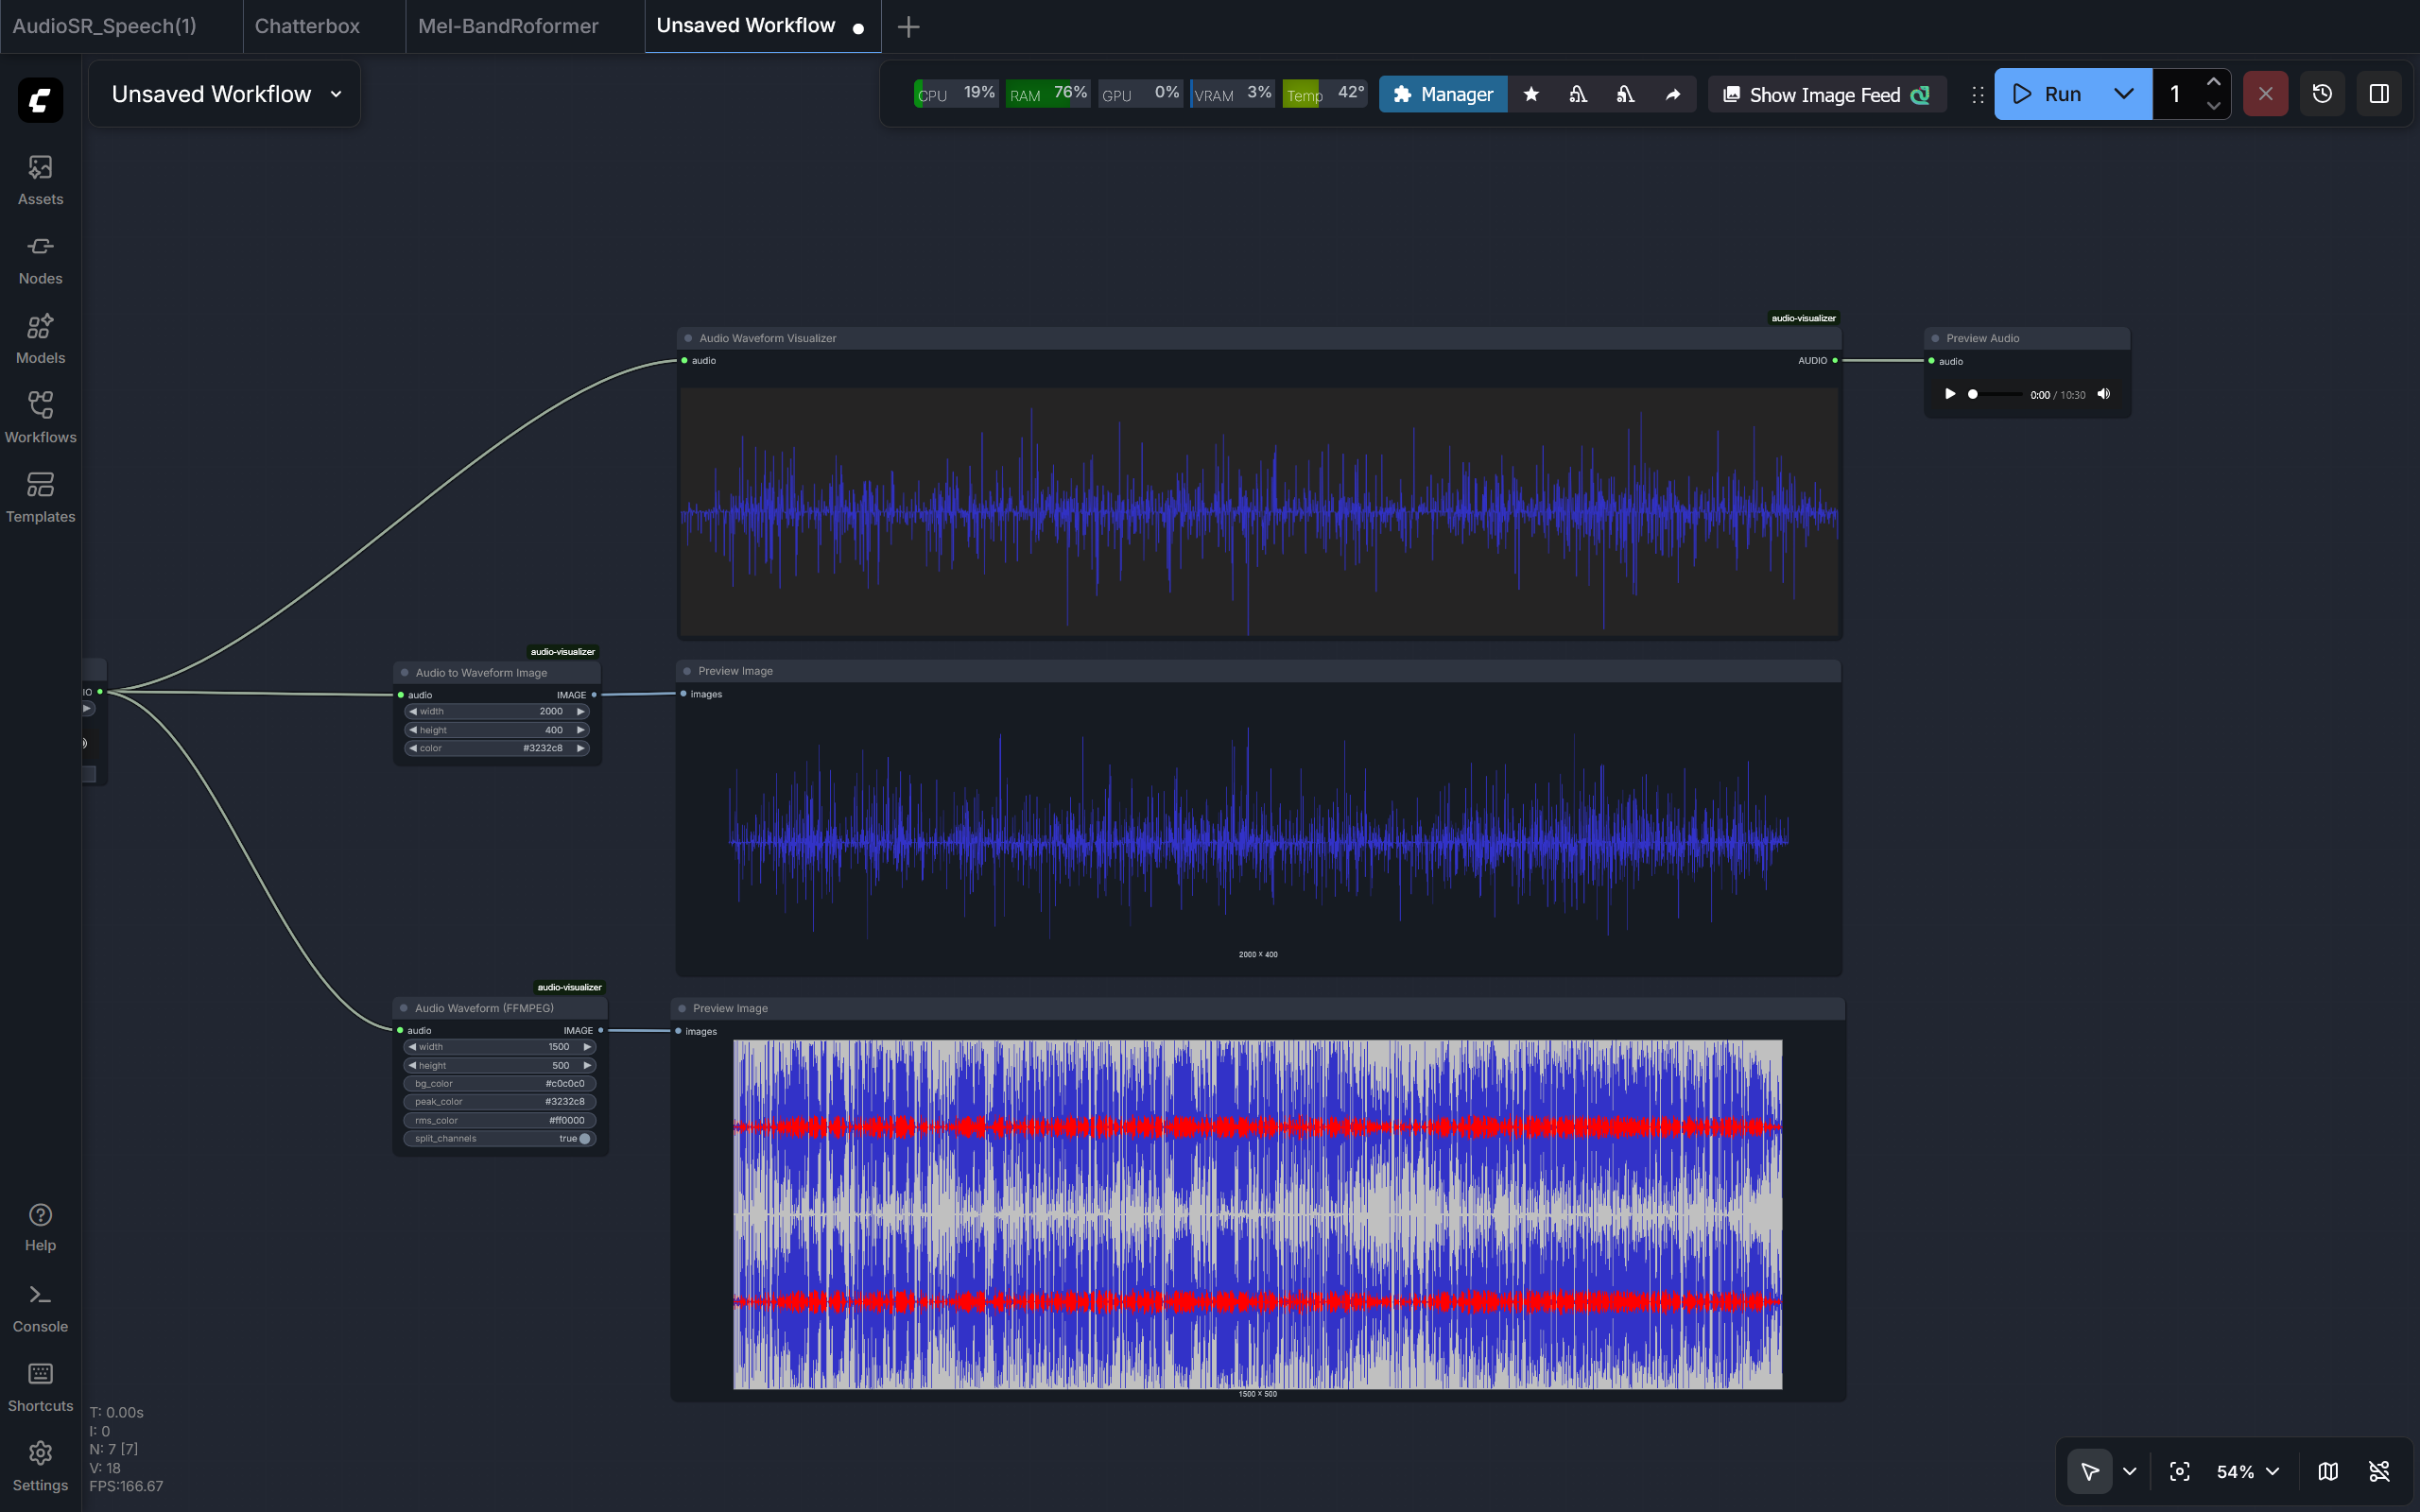
Preview
---
Features
- Real-time Visualization: View waveforms directly on the canvas.
- Image Generation: Generate image tensors using Matplotlib or FFmpeg.
- Customization: Control over colors, dimensions, and layout.
- Performance: Optimized for long audio files via downsampling.
---
Quick Start
1. Prerequisite: FFmpeg
Required for the Audio Waveform (FFMPEG) node.
- Linux:
sudo apt install ffmpeg - macOS:
brew install ffmpeg - Windows: Download from gyan.dev and add to PATH.
2. Installation
cd ComfyUI/custom_nodes/
git clone https://github.com/kaushiknishchay/ComfyUI-Audio-Waveform-Visualizer audio-visualizer
pip install -r requirements.txt
---
Node Breakdown
1. Audio Waveform Visualizer
A high-performance JS-based visualizer for immediate feedback.
- Output:
AUDIO(Pass-through) - UI: Interactive canvas.
2. Audio to Waveform Image (Matplotlib)
Generates an image tensor using Matplotlib.
- Output:
IMAGE(RGBA) - Customization: Supports hex colors and custom dimensions.
3. Audio Waveform (FFMPEG)
Visualization using FFmpeg filters.
- Output:
IMAGE(RGB) - Features: Peak/RMS visualization, Stereo channel splitting.
---
Example Workflow
Find the reference workflow in workflows/AudioWaveform.json.
---